Proudly introducing Analysis Charts, one of the valuable products of FXCE. With this advanced toolkit, investors can easily analyze the trading strategies of Masters/Traders, thereby forming an overall assessment of the trading methods as well as the stability of their trading system.
To use this toolkit, go to the details page of the trading account you want to analyze and select the "Analysis" section.

Type of charts in Analysis Charts Toolkit
There are 3 typs of charts in the Analysis Charts toolkit:
VOLUME - ORDERS CHART
The Volume - Orders Chart is used to analyze the total number of orders and the total trading volume of active orders. With this chart, you can assess the trading sequence through the total number of orders and the total trading volume of this sequence.
How to view the Volume - Orders Chart:
-
In the top right corner of the chart, select the total number of transactions, with 50 as the largest number of transactions.
-
The line chart (green) shows the total number of orders, and the bar chart (blue) displays the total trading volume of the trading sequence.
The chart shows the latest total numbers of transactions. To view previous transactions, just drag horizontally.


Updates
The trading account that trades with DCA method will be marked with an icon show below.

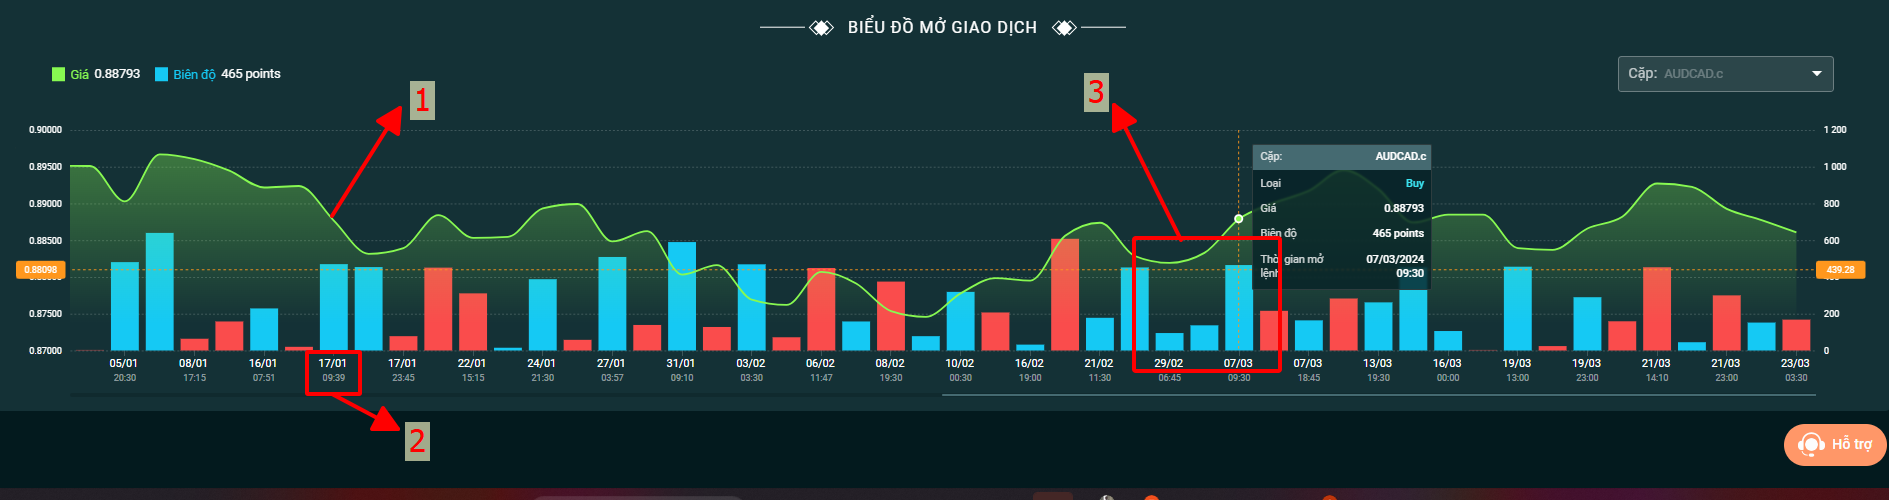
OPEN DEALS CHART
With the Open Deals Chart, you can analyze:
-
The trading price of a specific currency pair at a specific time.
-
The price difference between the selected order and the previous order, measured in points.
Through this, you can assess the amplitude of the active orders.
How to view the Open Deals Chart
-
Choose the currency pair and the total number of transactions to display, up to 50 transactions.
-
Click on a point on the chart to view:
-
Price
-
Type of transaction (buy/sell)
-
Amplitude
-
Opening time
-
The chart shows the latest total numbers of transactions. To view previous transactions, just drag horizontally.


DEALS - EQUITY CHART
The Deal - Equity Chart provides you with a specific view of the assets and trading volume of a trading account at a particular trading time. As a result, you can assess the stability of the trading account through the fluctuations in assets and the trading volume of that account.
How to view the Open Deals Chart
-
Choose the total number of transactions to display, up to 50 transactions.
-
Click on a point on the chart to view:
-
Type of transaction (buy/sell)
-
Asset
-
Volume
-
Opening time
The chart shows the latest total numbers of transactions. To view previous transactions, just drag horizontally.


Application of Analysis Chart toolkit:
Volume - Order chart and Deals- Equity chart
The Deals - Equity Chart and the Volume - Order Chart complement each other, providing the necessary statistical information from the main account:
(1) The system trades with DCA (the DCA symbol lights up).
(2) Maximum trade (3 trades) and highest volume is 0.3 lots, indicating the highest level of risk for the account.
(3) No Order Times, representing the closing of previous transactions before opening new transactions.
(4) Consistent trading volume at different times indicates a consistent trading approach.
(5) The account participates in two-way buy/sell transactions simultaneously, demonstrating flexibility in trading strategies.
(6) Account equity at the time of entering a new trade.

Open Deals Chart
The Open Deals Chart supports the analysis of accounts using the DCA system in trading, with information that can be referenced from the master account:
(1) Entry price levels are displayed on a line chart, providing insight into whether the master is trading with or against the trend.
(2) Entry times reveal the master's basic entry methods: based on conditions, candle closing, or session timing.
(3) The distance between trades of the same direction applies DCA analysis, indicating whether the master is progressively increasing their position size, as evidenced by widening gaps.
Through the use of charts provided by FXCE, you can capture important information about your Master account's trading activity. From assessing account stability to analyzing trading strategies and order execution, these charts will be useful tools to help you make smarter and more effective investment decisions. in the foreign exchange market