Do you want to know a metric that measures your account's trading performance over time? Or to compare profit growth between multiple accounts to choose to invest?
CAGR/MDD is the answer to your questions. To understand well this measurement, let's start learning about the CAGR metric first.
What is CAGR?
CAGR (Compound Annual Growth Rate) is a business and investment term, specific for annual investment income over a certain period.
For trading, CAGR plays a role as a measure of an account's growth over trading time and predicts future expected profits. In addition, you can rely on this metric to compare growth rates among accounts.
Usually, the higher the CAGR, the better the trading activity, which provides a high profit. However, this metric does not reflect trading risk.
CAGR formula: CAGR = Growth / Years
Example:
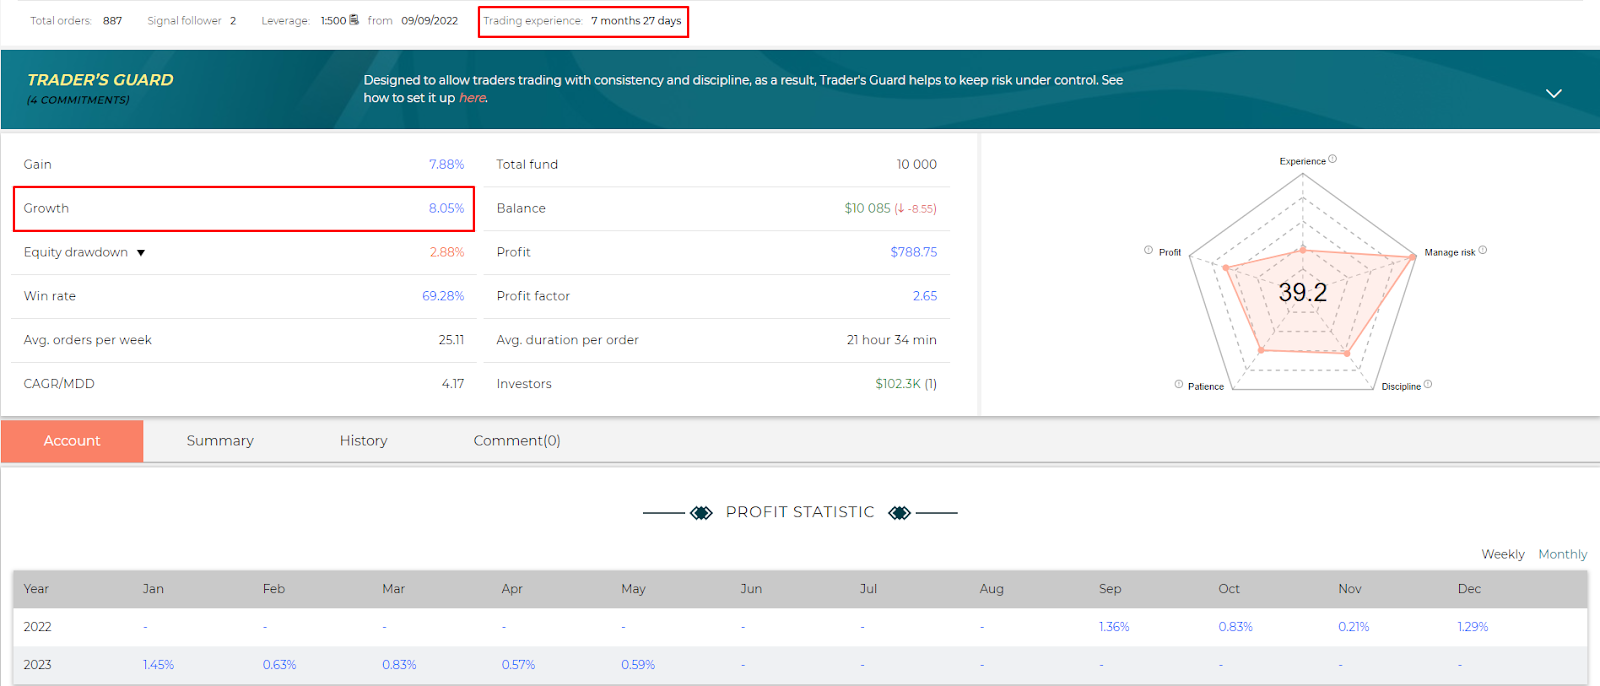
Trader trades for 7 months 27 days, approximately 8 months => Years = 8/12 =0.67
|
Growth |
Years |
CAGR |
|
8.05 |
0.67 |
12.01 |
What is special about CAGR/MDD?
CAGR/MDD is a measure of compound annual profit growth but adjusted for the maximum drawdown (Max Drawdown) incurred during the trading.
Because it is based only on the terminal value, the CAGR ignores volatility over the trading time. The addition of the Drawdown makes CAGR/MDD become a measure of the annual yield per maximum drawdown.
The metric helps the user to analyze the highest possible risk to the total growth of the trading account. The higher CAGR/MDD, the better the risk-adjusted return.
If account A has CAGR of 30% and a maximum Drawdown of 15%, the CAGR/MDD ratio is 2. If account B has a CAGR of 35% and a maximum Drawdown of 20%, the CAGR/MDD ratio is 1.75. Although account B has a higher compound growth rate, but from a risk perspective, account A is considered superior.
Based on CAGR/MDD:
-
Traders can evaluate the overall quality of their trades to adjust the system and methods in time.
-
Investors can use this measurement to quickly compare the performance of trading accounts and create a portfolio tailored to their risk appetite.
Example:
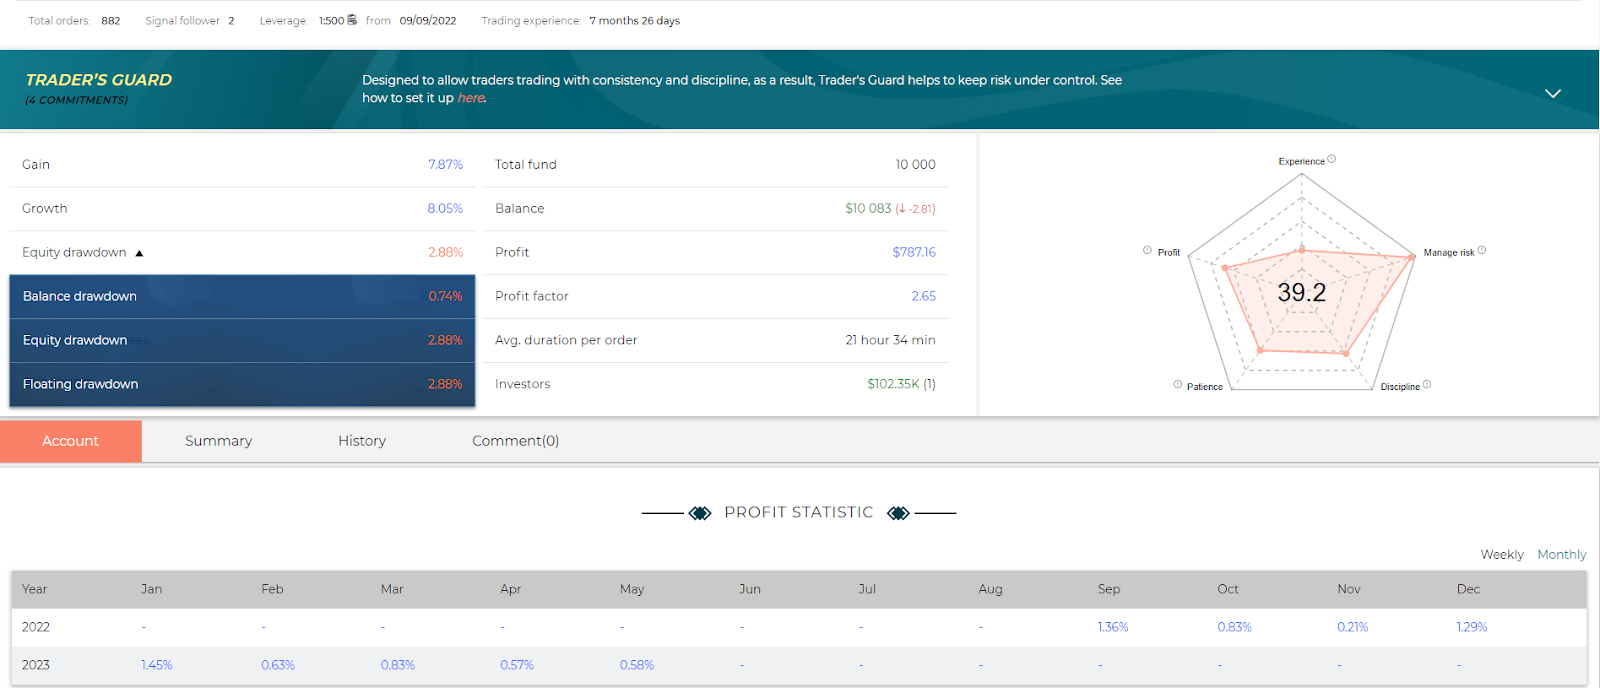
Traders can test the highest Drawndown on FXCE STP. In this case, Max Drawndown = Equity Drawndown = Floating Drawndown = 2.88%.
|
Growth |
Year(s) |
CAGR |
MDD |
CAGR/MDD |
|
8.05 |
0.67 |
12.01 |
2.88 |
4.17 |
You have understood CAGR/MDD which is newly launched on the FXCE Social Trading platform. Wish you always make the best trading decisions!
Create an account quickly and start trading today at FXCE!!!
Follow the FXCE latest news and updates at the following channels:
Facebook | Telegram | Instagram | Youtube